Vision Zero High Injury Network Prioritization
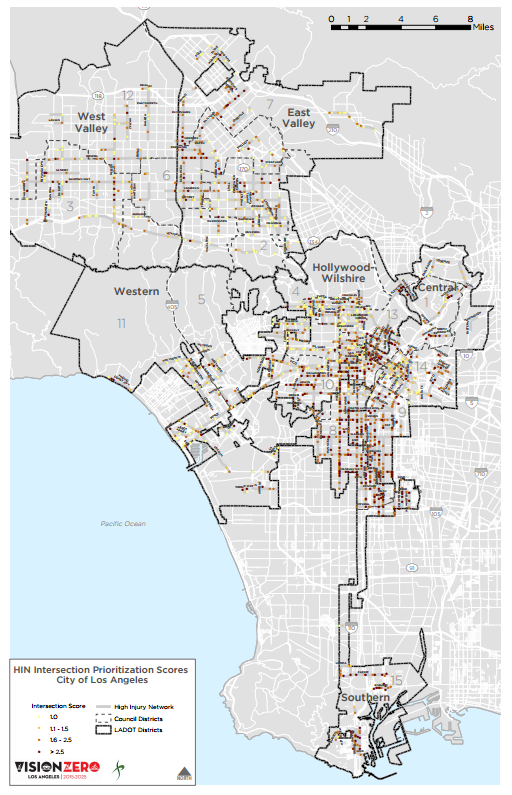
At the May 17 convening of the Vision Zero Task Force, the Los Angeles Department of Transportation (LADOT) presented a new version of the High Injury Network (HIN) map. This new map includes a new score for each intersection to begin to prioritize Vision Zero efforts in Los Angeles.
LADOT has been undertaking a technical collisions analysis as part of the initial steps towards a Vision Zero work plan. This analysis seeks to find patterns among the various collisions along the HIN to better inform approaches to engineering, education, and enforcement. However, while the HIN represents only 6% of the city’s street network, at roughly 450 miles there is still need for additional location prioritization.
Thus, the Vision Zero team developed a series of six potential location-based priorities for developing a “intersection score” to begin to prioritize locations along the HIN, listed below:
- Severity: Locations with the highest amount of severe or fatal injury (KSI) collisions
- Vulnerability: Locations with KSI collisions that involve older adults or children
- Social Equity: Locations within traditionally underinvested in or underserved communities
- Geography: Locations that have the most collisions in an Area Planning Commission, Council District, or other zones
- Dangerous Behavior: Focus on locations that involve KSI collisions resulting from dangerous behavior
- Low-Cost, Low-Complexity: Focus on locations that can be easily fixed through low-cost and low-complexity countermeasures.
These six potential priorities were put to a survey with the Vision Zero Alliance, the Vision Zero Executive Steering Committee, the Vision Zero Task Force, the city’s Pedestrian and Bicycle Advisory Committees, and each of the City Council offices. Additionally, the Vision Zero Alliance distributed the survey in an online setting to their network.
After 522 online surveys, 62 in person surveys, and a variety of in-person feedback, LADOT received the following results:
| Safety Priority | Combined Weighted Score |
| Severity | 0.478 |
| Vulnerability | 0.361 |
| Social Equity | 0.333 |
| Dangerous Behavior | 0.303 |
| Geography | 0.273 |
| Inexpensive & Simple | 0.252 |
Based on this feedback, the following methodology was developed for scoring each intersection on the HIN
Intersection Score = count_fatal_ksi*1.5 (weighted higher for severity) + count_severe_ksi (raw value) + child_senior (0 or 1 if child/senior was present in KSI) + target_community (0 or 1 if location in target community)
This new map has afforded each of the Vision Zero Subcommittees the ability to zero in on locations that are higher priority. Stay tuned for the launch of the Vision Zero Action Plan, which will include a prioritized list of corridors and intersections on this map.
Other interesting facts:
The highest scoring intersection, at 7.5, was Bonnie Brae / Olympic.
No one intersection had a severe/fatal count higher than 7 (from 2009 – 2013)
Only 46 intersections involved more than 1 child/senior in a KSI collision


